
SharePoint migration ROI calculator
Use this free SharePoint migration ROI calculator to estimate what moving and reorganizing your content into governed SharePoint is worth to you, measured in retired costs, reclaimed time, reduced risk, and payback months. A productivity-only model misses most of the value. This one starts with what a migration takes off your books. You switch off legacy systems. You stop pouring IT hours into upkeep. You leave junk behind instead of paying to store it, and you shrink the security and compliance exposure that comes with aging file shares.
dataBridge built it from 20 years of SharePoint migration work, using the same business-case math we run for clients weighing a move off file servers, old SharePoint, or a third-party system. Put your own numbers in below and it recalculates as you go.
SharePoint migration ROI calculator
Estimate the business case for moving and reorganizing content from file servers, legacy SharePoint, or third-party systems into governed SharePoint — built around what you stop paying and stop risking, not just productivity. Tune the assumptions and everything recalculates live.
Annual recurring benefit
Multi-year net benefit
Payback
Multi-year ROI (×)
Assumptions
Enter your own figures. The migration investment is an input you control — this is a business case, not a price quote.
Legacy systems retired
$
$
Data & ROT
%
$
Risk exposure
%
$
%
Productivity (optional)
$
Leave at 0 to keep the case purely cost-and-risk driven, or pull a figure from the intranet ROI calculator if findability gains apply.
Investment
$
$
Horizon
Where the annual benefit comes from
Each year of recurring value, broken out by source.
Scenario sensitivity
Conservative and optimistic cases share your cost and investment assumptions and vary only the three uncertain drivers — ROT eliminated, risk reduction, and incident probability. Edit the highlighted cells to stress-test the case.
| Scenario | ROT % | Risk reduction | Incident prob | Annual benefit | Year 1 net ($) | ROI (×) | Payback |
|---|---|---|---|---|---|---|---|
| Conservative | |||||||
| BaseLive inputs | |||||||
| Optimistic |
Cost of delay: every year your content stays on legacy systems costs roughly in eliminable spend and avoidable risk exposure — before counting the rising cost of migrating later, under worse conditions.
In the scenario table, Year 1 net is a dollar figure — recurring benefit minus all Year 1 costs (migration project plus first-year advisory). It is expected to turn negative on larger projects, where the build is absorbed before a full year of savings accrues. Multi-year net benefit and ROI are measured across your full evaluation horizon; ROI is a multiple, not a percentage. Storage & ROT savings reflect the go-forward cost avoided by not carrying redundant or obsolete content into the new environment — separate from, and not double-counted with, retiring the legacy systems themselves. Risk exposure avoided is modeled as incident probability × incident cost × risk reduction, a directional estimate rather than a guarantee. Actual results depend on what legacy systems are retired, data quality, governance, and execution — treat these figures as a directional business case, not a quote. For the migration-project figure this model asks you to enter, our breakdown of what a SharePoint migration actually costs gives you a grounded starting range.
How this migration ROI calculator works
Most migration ROI claims collapse the moment a CFO looks at them, because they rest entirely on the idea that people will find things faster. This model starts somewhere firmer. It tallies the recurring value a migration creates each year: the annual cost of the systems you retire, the IT labor you win back, the go-forward storage you skip by not hauling redundant content into the new environment, and the risk you remove by consolidating onto one governed platform. Productivity sits in as an optional input rather than the headline, so the case stands up before you count a single saved search. When findability gains are part of your case, size them with the SharePoint intranet ROI calculator and bring that figure into the optional productivity field.
You enter the migration cost yourself. The tool never hands you a quote. That is the whole point. You set the investment, and the calculator tells you what it returns. Payback comes out of cumulative cash flow, meaning the month your savings finally pass what you spent. Net benefit and ROI run across your full evaluation horizon, so the near-term and the long-term both show up.
What drives SharePoint migration ROI
A few inputs move the result more than all the others put together, and they are not the ones that drive an intranet.
Decommissioning carries the most weight. When you retire file servers, on-premises SharePoint, or a third-party document system, the recurring hardware, maintenance, backup, and license costs go with them. Finance can watch those line items drop out of next year’s budget. It is the main reason a file share to SharePoint migration tends to pay for itself sooner than people expect.
Then there is the junk. Most teams badly underestimate how much of their stored content is redundant, obsolete, or trivial, and the real figure usually lands between 30 and 60 percent. Move it forward and you are paying to store and secure files nobody opens. A structured migration is your chance to drop it, which is why you map content before you move it rather than after. Our guidance on mapping legacy folders to metadata shows how that reorganization gets done.
Risk is the lever an intranet calculator leaves out completely. Legacy file shares come with permissions that have sprawled for years, no built-in retention or sensitivity controls, and old systems that make easy targets for a breach. Moving into a governed SharePoint environment lowers that expected cost, and you can model it directionally even when the precise number is fuzzy. The discipline behind it runs through our SharePoint governance guide.
Before you take anything to leadership, run the conservative scenario. If the migration still returns a solid multi-year number with risk reduction turned down and ROT set low, the business case will hold.
A worked example
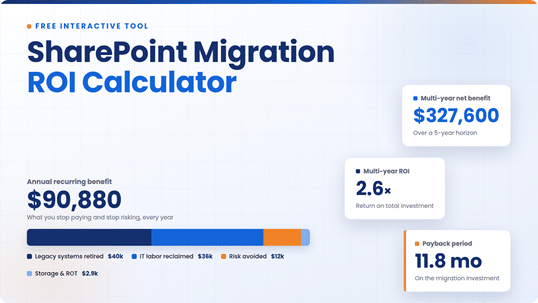
Picture a 150-employee organization that retires roughly $40,000 a year in legacy systems, spends about 400 IT hours a year keeping them alive, and sits on six terabytes of data that is around 40 percent ROT, with a realistic level of risk on its current file shares. The model puts recurring annual benefit near $90,880, a little over $600 per employee, on an $80,000 migration with dataBridge’s $9,360 advisory partnership. Payback comes in around 12 months. Over five years the migration returns roughly $327,600 net, about 2.6 times the total investment. Your figures will land somewhere else, and that is what the inputs are for.
Frequently asked questions
How do you calculate the ROI of a SharePoint migration?
Total up the recurring value the migration creates each year: the legacy systems you switch off, the IT hours you get back, the storage you skip by leaving redundant content behind, and the risk a governed environment takes away. Subtract your one-time migration investment and any ongoing advisory across the years you are measuring. ROI is the net benefit divided by the total you put in. The calculator on this page does the arithmetic for you.
How much does a SharePoint migration cost?
Scope drives the number. Most mid-market migrations run $50,000 to $100,000, and larger reorganizations that pull from several legacy systems climb to $100,000 to $200,000 or beyond. SharePoint comes bundled in most Microsoft 365 licenses, so there is rarely a separate platform fee. What you pay for is the migration work, the content reorganization, and any ongoing advisory. Our SharePoint migration services page shows how we scope it.
What is the payback period for a SharePoint migration?
For a well-scoped project, expect somewhere between 9 and 18 months. It stretches when the migration is large compared with the legacy costs it clears out. Migration value is mostly cost-out rather than a productivity multiplier, so the payback tends to be steadier and easier to defend than an intranet’s.
Why migrate off file servers to SharePoint?
File servers keep costing you in hardware, backups, and maintenance, they hold permissions that have drifted for years, and they give you nothing for retention, data-loss prevention, or AI readiness. A governed SharePoint environment clears that overhead and puts your content within reach of search, Teams, and Copilot. The usual reasons these projects stall are laid out in why most SharePoint migrations fail.
How much content is usually redundant, obsolete, or trivial?
For most organizations, 30 to 60 percent. Carrying that forward means paying to store and protect files nobody touches. A structured migration is the moment to leave it where it sits, and getting your information architecture and metadata sorted first is what makes that possible.
Does migrating to SharePoint reduce security and compliance risk?
It does, as long as governance leads the project instead of a straight lift-and-shift. Pulling everything onto one governed platform lets you set consistent permissions, retention, and sensitivity rules, and it retires the aging, unpatched systems that breaches so often walk in through. Our work on records management and retention shows how that protection gets built in from the start.
Is the number this calculator gives me a quote?
No. It gives you a directional business case. You supply your own migration budget, and the tool shows what that spend brings back. For a real quote tied to your systems, dataBridge validates your assumptions against your live environment, which usually begins with a SharePoint migration readiness assessment.
Want this business case built for your organization?
dataBridge has spent 20 years moving and reorganizing content into SharePoint that teams rely on every day. We will pressure-test your assumptions against your real systems, scope the work, and show you what the migration gives back. Schedule a free structured consultation, or start with a SharePoint migration readiness assessment.