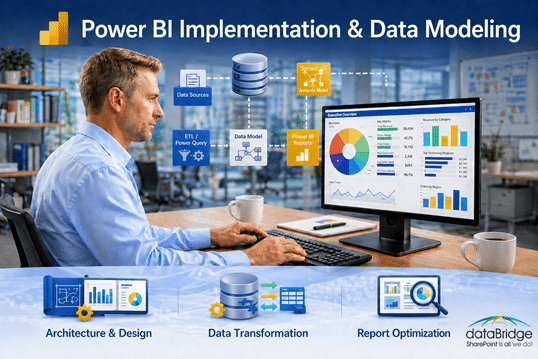
Power BI Implementation & Data Modeling
Power BI implementation works best when the reporting layer is built on a clean, reliable data model. dataBridge helps organizations connect business data, structure semantic models, improve reporting performance, and create Power BI dashboards that leaders and teams can actually trust.
Most Power BI projects begin with a dashboard request. Someone wants sales visibility, operational reporting, executive KPIs, or a better way to replace spreadsheets. That request is valid, but the dashboard is only the visible part of the solution.
The real work sits underneath it.
If the data sources are unclear, the model is too flat, the measures are inconsistent, or ownership is missing, the report may look finished while the numbers remain hard to defend. dataBridge helps organizations implement Power BI with the structure, modeling discipline, and governance needed to support confident decision-making over time.
Build the Model Before You Build the Dashboard
A good Power BI report does not start with colors, charts, or layout.
It starts with the question the business is trying to answer.
That sounds simple, but it is where many Power BI implementations go sideways. A team asks for a dashboard, the build starts quickly, and the first version looks promising. Then the harder questions arrive.
Why does finance show a different revenue number?
Which date should drive the trend line?
Who owns the definition of active customer?
Should this metric include pending work, closed work, or both?
Why does the report slow down when more users adopt it?
Those are not just reporting questions. They are modeling questions.
Through Power BI Consulting & Reporting Services, dataBridge focuses on the foundation first so reports are easier to maintain, easier to explain, and easier to scale.
Why Data Modeling Determines Power BI Success
Power BI gives organizations a powerful reporting platform, but it does not automatically create trusted analytics. The quality of the model determines whether users believe the report.
A weak model usually shows up in familiar ways:
- Slow dashboards
- Conflicting KPI definitions
- Too many one-off reports
- Unclear measure logic
- Duplicate datasets
- Broken refreshes
- Reports that only one person understands
- Users exporting to Excel because they do not trust the dashboard
The problem is rarely Power BI itself.
More often, the model was built around the first reporting request instead of the long-term reporting environment. That creates hidden technical debt. A quick dashboard becomes a collection of disconnected measures, confusing relationships, and reports that are difficult to improve without rebuilding major pieces.
Strong Power BI implementation treats the data model as business architecture, not just a development task.
What Effective Power BI Implementation Looks Like
Every organization has different data sources, reporting needs, and adoption challenges. Still, healthy Power BI environments tend to share the same foundations.
They define the business questions before building visuals.
They separate facts, dimensions, and measures in a way people can understand.
They make refresh, security, and ownership part of the design.
They test reports against real decisions, not just sample data.
They give users one trusted place to go for key metrics.
That approach takes more thought up front, but it prevents a lot of cleanup later.
1. Business-Aligned Discovery
Before we design the model, we need to understand how the organization uses data today.
That includes the formal reporting process and the informal reality. Many teams have official dashboards, spreadsheet workarounds, department-specific definitions, and “shadow reports” that exist because the trusted source never fully worked.
During discovery, dataBridge typically clarifies:
- Key business questions
- Executive and operational reporting needs
- KPI definitions
- Data source ownership
- Refresh expectations
- Security requirements
- Report audiences
- Known reporting frustrations
This is similar to the planning discipline used in SharePoint Strategy & Roadmapping. Structure has to come before configuration, or the finished solution reflects old confusion in a cleaner-looking interface.
A useful Power BI discovery session should not only ask, “What report do you want?”
It should also ask, “What decision should this report help someone make?”
2. Scalable Semantic Model Architecture
The semantic model is where Power BI becomes either manageable or fragile.
A good model gives the business a shared layer for definitions, relationships, and calculations. It reduces the need for duplicate logic across reports and makes future reporting easier to extend.
Depending on the data and use case, dataBridge may design around:
- Star schema structure
- Fact and dimension tables
- Reusable measures
- Clear table and column naming
- Optimized relationships
- Defined KPI ownership
- Separate development and production workspaces
- Documentation for future support
This is where many reporting environments quietly accumulate problems. A model can work for the first dashboard and still be wrong for the broader business. That is why implementation should account for the second, third, and tenth report before the first report is treated as complete.
3. Data Preparation and Refresh Planning
Power BI reports are only as reliable as the data they receive.
Some environments need clean connections to SQL databases, Excel files, SharePoint lists, Dataverse, ERP systems, CRM platforms, or other line-of-business tools. Others need reporting logic across several sources that were never designed to work together.
Data preparation often includes:
- Cleaning inconsistent field values
- Removing unnecessary columns
- Shaping data for reporting
- Preserving query folding where possible
- Planning refresh frequency
- Handling large transaction tables
- Reducing refresh failures
- Documenting source system limitations
Refresh planning deserves attention early. A report that refreshes well with a small sample may behave very differently once transaction history grows, more departments adopt it, or leadership expects near-current reporting.
Performance and reliability should not be left until after users complain.
4. Performance Optimization from the Start
Performance issues usually arrive after a dashboard becomes useful.
At first, the report works. Then more data is added. More visuals are created. Additional slicers appear. Users ask for drill-through pages. The model grows, and suddenly the dashboard feels slow.
dataBridge looks for performance risks before the report becomes business-critical.
Common areas include:
- High-cardinality columns
- Unnecessary bi-directional relationships
- Overly complex DAX
- Too many visuals on a page
- Large imported tables
- Poorly shaped source queries
- Measures that repeat the same logic
- Refresh schedules that conflict with source system timing
Power BI performance work is not only technical. It also requires restraint. Not every metric belongs on the same page, and not every report should carry every possible slice of data.
Good report design makes the important decisions easier to see.
5. Governance, Security, and Ownership
Power BI does not operate outside Microsoft 365 governance.
Reports, workspaces, semantic models, permissions, refresh ownership, and data access all need clear rules. Without them, the reporting environment can become just as messy as the spreadsheet environment it was supposed to replace.
dataBridge helps organizations define practical governance around:
- Workspace structure
- Semantic model ownership
- Row-level security
- Dataset certification
- Report promotion
- Refresh monitoring
- Access reviews
- Naming standards
- Lifecycle management
This work often connects to broader Microsoft 365 Consulting & Strategy and SharePoint Security & Compliance efforts. The goal is not to overcomplicate reporting. It is to make sure people know which reports are trusted, who owns the data, and how changes should be managed.
A dashboard without ownership eventually becomes another unmanaged asset.
6. Reports Designed Around Decisions
The report layer comes after the model is stable.
That does not mean design is unimportant. It means visual design should support the decision, not distract from it. A useful Power BI dashboard helps someone understand what changed, why it matters, and where to look next.
Effective reports usually include:
- Clear visual hierarchy
- Business-friendly labels
- Consistent KPI definitions
- Focused report pages
- Useful filters
- Drill paths that match real workflows
- Fewer vanity visuals
- More emphasis on action
Some dashboards are technically accurate but still fail because users cannot quickly understand what they are supposed to do with the information.
That is why dataBridge designs the reporting layer around how people actually work.
Common Power BI Implementation Pitfalls
Power BI projects often struggle for reasons that are easy to miss early.
The first dashboard may look fine. The trouble appears later, when another department wants to use the model, leadership asks for a different metric, or the original report builder is no longer available.
Common problems include:
- Building reports before defining the data model
- Connecting visuals directly to raw source tables
- Creating one dataset per report without a reuse strategy
- Letting every team define KPIs differently
- Ignoring security until late in the project
- Treating refresh failures as minor technical issues
- Overloading dashboards with too many visuals
- Failing to document measures, ownership, and assumptions
Individually, each issue may seem manageable.
Together, they create a reporting environment that people slowly stop trusting.
How dataBridge Approaches Power BI Implementation
dataBridge uses a structured implementation approach because Power BI success depends on more than report development.
The work has to connect business goals, data architecture, security, usability, and long-term support. A dashboard can be built quickly. A trusted analytics environment needs more discipline.
Assess & Discover
We begin by reviewing the business goals, reporting pain points, data sources, and current-state reporting process.
This phase helps uncover the gaps that are not always obvious from the dashboard request alone. Sometimes the issue is a missing metric. Other times, the issue is unclear ownership, inconsistent source data, or a reporting process that relies too heavily on manual spreadsheet cleanup.
Model & Architecture Design
Next, we design the reporting architecture.
That may include semantic model design, data source planning, measure logic, workspace structure, security boundaries, and report lifecycle decisions. The goal is to create a model that can support more than one immediate report.
A strong model gives the organization a reporting foundation that can grow.
Build, Optimize & Validate
Once the architecture is clear, we build the model and reports.
Validation matters here. We compare outputs against known business scenarios, review assumptions with stakeholders, and tune the model before the reporting environment becomes widely used.
The most important question is not only, “Does the report load?”
It is, “Do the right people believe the numbers?”
Enable, Govern & Support
After launch, teams need a way to manage the environment.
dataBridge helps define ownership, training needs, support processes, workspace standards, and governance practices so Power BI does not become another unmanaged reporting layer.
This is where implementation connects to long-term adoption.
Where Power BI Fits Inside Microsoft 365
Power BI often becomes more valuable when it is connected to the broader Microsoft 365 environment.
Many organizations already store important operational information in SharePoint, Teams, Lists, Excel, Dataverse, and Power Platform solutions. The challenge is turning that information into useful reporting without creating another disconnected system.
dataBridge helps organizations connect analytics work to their wider Microsoft 365 strategy through Data Analytics & Reporting Services, Power BI consulting, and governance planning across SharePoint and Power Platform.
That matters because reporting does not stand alone.
A Power BI dashboard may depend on SharePoint metadata, Power Apps process data, Power Automate workflow outputs, or operational information from business systems. If those sources are poorly structured, the report inherits the problem.
Better analytics starts with better information structure.
Why Organizations Choose dataBridge
Organizations usually come to dataBridge when Power BI has started to show promise but the environment needs more structure.
That may happen after a few dashboards have been built, when leadership wants more reliable reporting, or when teams realize the current model will not scale.
Clients often need help with:
- Stabilizing inconsistent reports
- Improving slow dashboards
- Cleaning up semantic models
- Standardizing KPI definitions
- Connecting multiple data sources
- Designing executive reporting
- Preparing Power BI for broader adoption
- Aligning analytics with governance
Our focus is practical. We help organizations build Power BI environments that people can use, understand, and support after the initial launch is over.
Frequently Asked Questions
Why is data modeling so important in Power BI?
Data modeling affects the accuracy, performance, and maintainability of Power BI reports. If the model is unclear, users may see conflicting metrics, slow dashboards, or reports that are difficult to update. A strong model gives the organization a more reliable foundation for reporting.
What is the best data model for Power BI?
There is no single model that fits every scenario, but many Power BI environments benefit from a well-designed star schema. Separating fact tables, dimension tables, and reusable measures can make reports easier to understand, optimize, and extend.
How long does a Power BI implementation usually take?
A focused Power BI implementation can often deliver useful reporting in a few weeks. Larger environments usually need a phased approach because data modeling, source system cleanup, security, validation, and governance take more time.
Can Power BI scale across departments?
Yes, but scale requires planning. Power BI becomes harder to manage when every department creates its own datasets, measures, and reporting rules. Shared semantic models, clear ownership, workspace standards, and governance help the environment grow without becoming fragmented.
How do you improve slow Power BI reports?
Slow Power BI reports usually need a review of the model, relationships, DAX measures, data volume, refresh design, and report layout. Sometimes the fix is technical. Other times, the report is trying to answer too many questions on one page.
Build Power BI on a Model People Can Trust
Power BI delivers the most value when the model behind the report is clear, governed, and built for the way the business makes decisions.
Attractive dashboards may get attention, but trusted models create lasting value.
If your organization needs better reporting performance, cleaner semantic models, or a stronger Power BI foundation, dataBridge can help through Power BI Consulting & Reporting Services that connect analytics strategy, data modeling, governance, and decision-ready reporting.